Guidebook
A baseball fan has the digestive apparatus of a billy goat. [They] can—and [do]—devour any set of diamond statistics with insatiable appetite and then nuzzle hungrily for more.
Reading the scorecard
The scorecard is the primary view of the game, available as the second tab on each game’s page.
The layout
Our scorecard layout follows a traditional format, with two halves: the top half is for the visiting team, bottom for the home team. Each half has a batters’ table, pitchers’ table, defensive diagram and spray chart, and game notes. At the top of each half is an area for supplementary game information, like manager names, uniforms, start and end time, weather, wind, and umpires.
The lineup
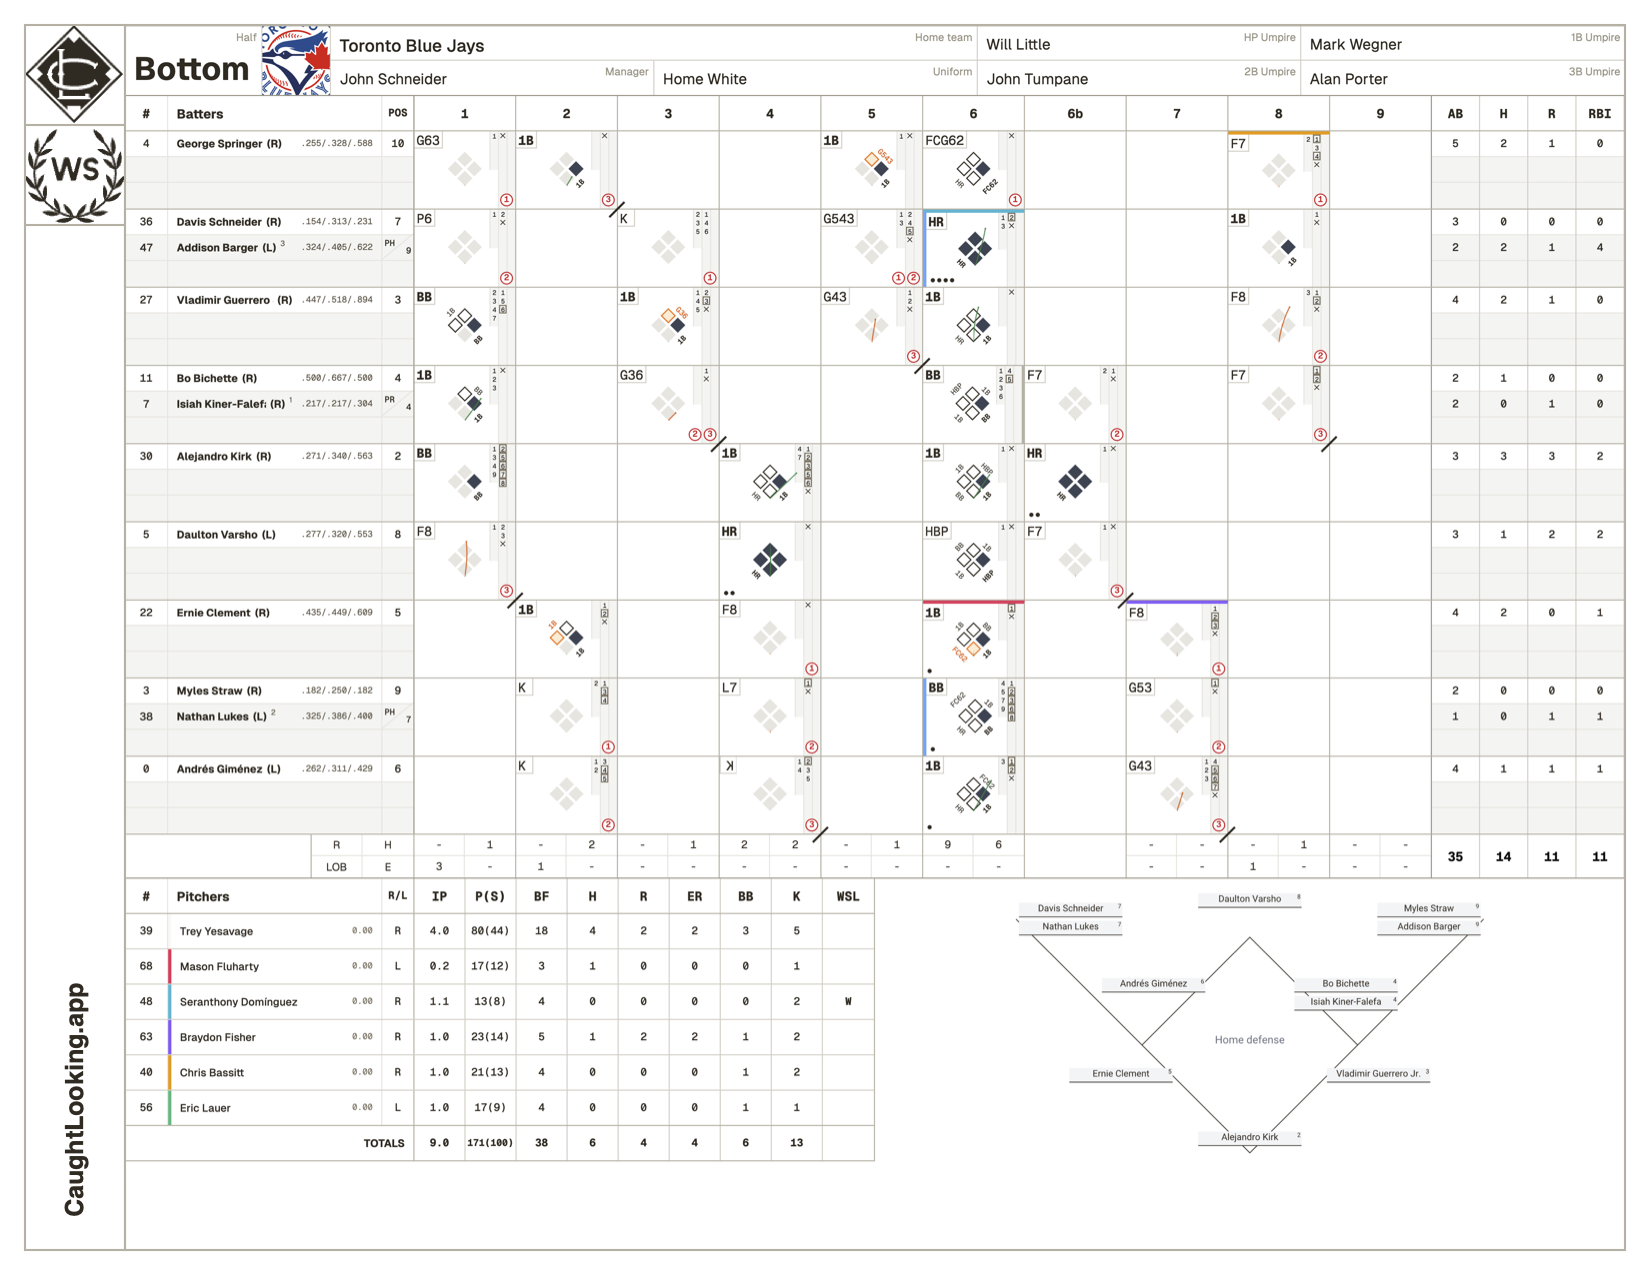
Each spot in the batting order gets a row with three slots. The starter1is listed first and substitutions2are added below. The first column shows their jersey number3, while the third column shows their position4using traditional position numbers (1 through 10; more on that below). If a player changes positions mid-game, their first position and last position are both shown, separated by a slash.5
Next to each player’s name is their slash line 6(average, on-base, and slug %), which is updated in real time during games. Footnotes next to a player’s name refer to game notes in the area below the scorecard.
The batter’s box
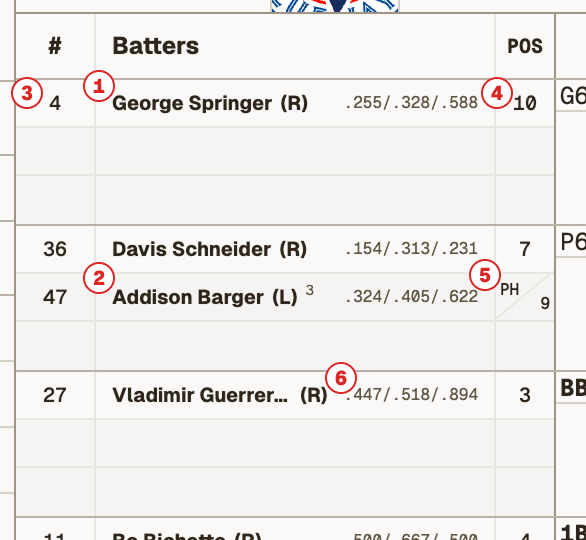
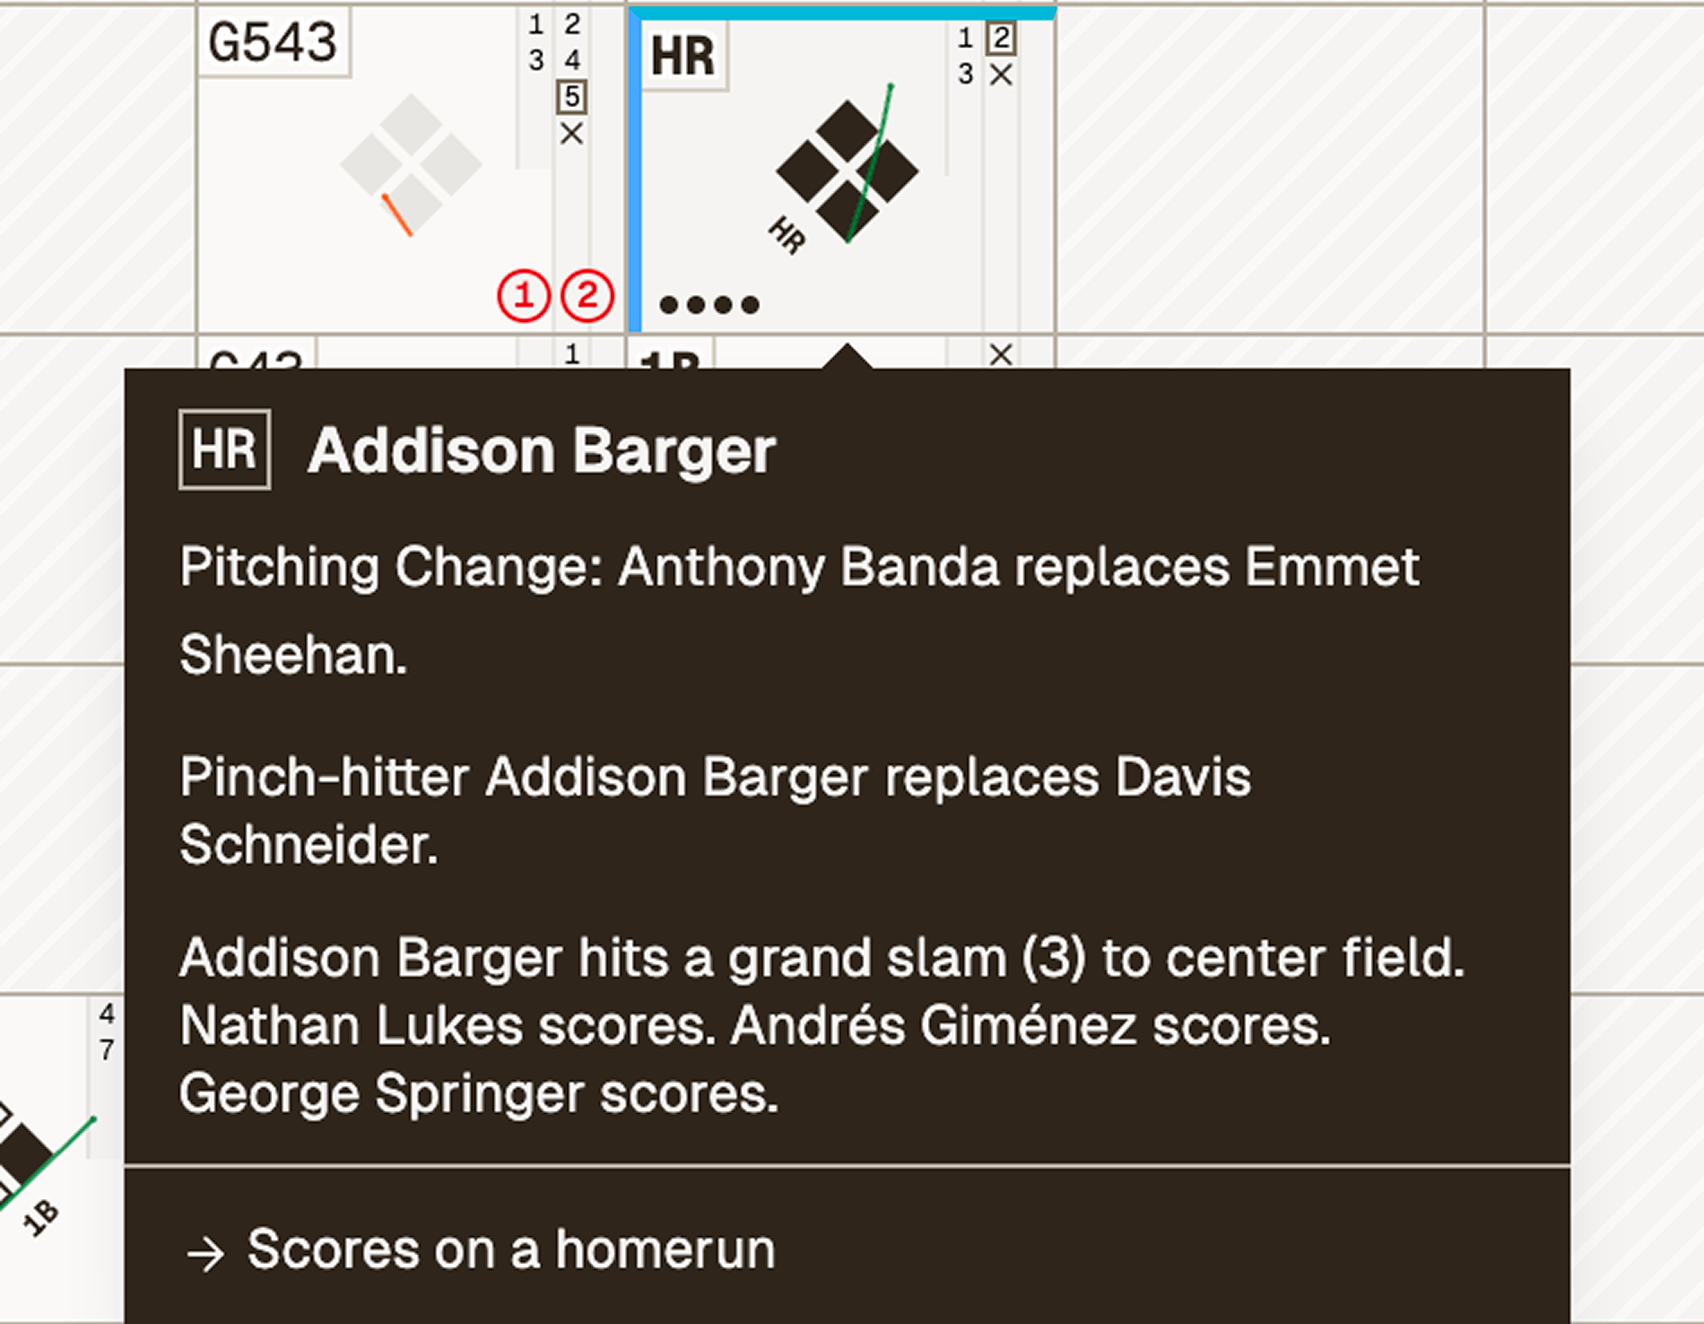
This batter’s box shows a pinch-hit grand slam to right-centre by Addison Barger. The count was 2-1, where the second pitch was fouled off.
Each column in the batters’ table represents a half-inning. Each column is made up of at-bat cells, or Batter’s Boxes, which are populated when an at-bat occurs. Batter’s Box content is outlined below. Note that a second column is added for bat-around innings.
- 1The at-bat or plate appearance result is shown in the top left corner, using traditional offensive or defensive shorthand to indicate what the batter did. If the batter or a runner was out on the play, the result includes the position numbers of any defenders involved. If a player reached base due to a hit or a walk, this label is shown in bold.
- 2RBIs are shown in the bottom left corner as small dots. One dot, one RBI.
- 3The pitch sequence is shown on the right hand side. The first column is for balls and the second and third columns are for strikes. The number is the pitch number within this plate appearance. A box around a number means it was a foul. A circle around a number means it was challenged, green for successful, red for unsuccessful, and yellow for pending. An X means the ball was put into play, which is always counted as a strike.
- 4Out numbers are shown in the bottom right. This example did not result in an out, so you won’t see it, but the one below does. These are shown as circled red numbers.
- 5The diamond diagram, in the centre of the box, shows how a player progressed around the bases. A solid base means they reached that base on the initial play. An outlined based means they advanced to that base on a subsequent play, either within their at-bat or one following. An orange base means they were thrown out on their way there. Small labels next to each baseline indicate how they got there, referring to subsequent plays as needed and only shown next to the last base they reached on the play.
- 6The hit trajectory for balls put into play is overlaid as a thin line (coloured orange if it was an out). This is an approximation as the scale of the batter’s box and diamond diagram doesn’t allow for a more accurate representation. Open the expanded batter’s box card to see a better overlay, including the ballpark outline if available.
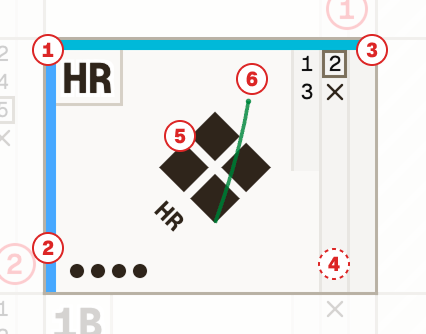
This batter’s box shows a fielder’s choice ground ball (FCG) to the shortstop who then threw to the catcher (62) by George Springer for the first out of the inning. The ball was put into play on the first pitch of the at-bat. First base is solid as he reached there on the play. Second, third, and home are outlined as he scored on a subsequent homer.
Tip: hover over a batter’s box to see written descriptions of what happened, as well as player names and their subsequent movements. Click or tap a batter’s box to open the at-bat card with more in-depth details.
Substitutions
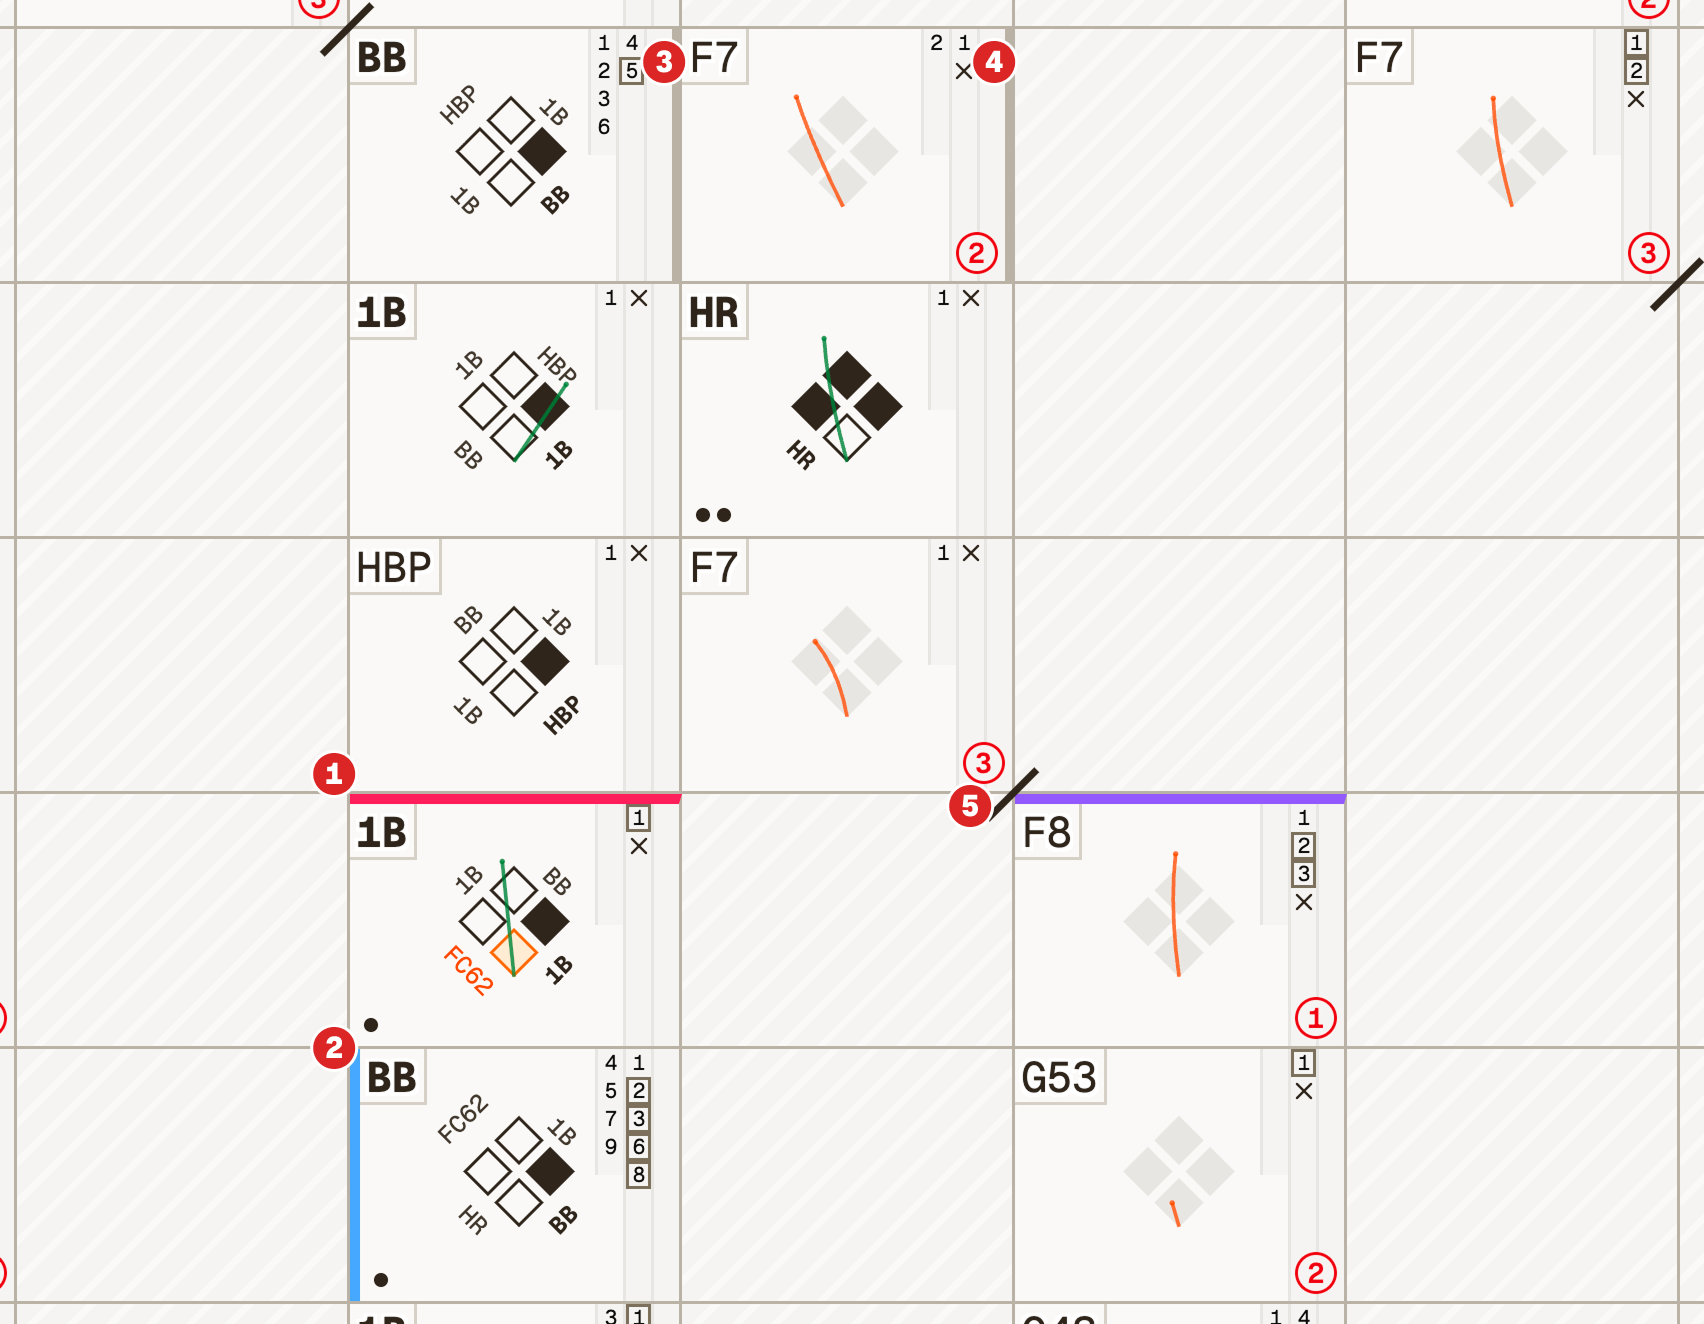
Also indicated in the batter’s box are substitutions, calls to the bullpen, and defensive replacements.
- 1Pitching changes are indicated by a horizontal line at the top of the plate appearance in which it took place. These lines are assigned different colours which match the colours shown next to pitchers’ names in the pitchers’ table.
- 2Pinch-hitters are shown as a vertical blue line on the left side of a batter’s box, indicating the substitution happened before the plate appearance did. The pinch-hitter’s name is added to the batting lineup with a corresponding game note.
- 3Pinch-runners are shown as a vertical grey line on the right side of a batter’s box, indicating the substitution happened after the plate appearance did. The pinch-runner’s name is added to the batting lineup with a corresponding game note.
- 4Defensive replacements are shown with the same vertical grey line, either on the left or right side of the batter’s box, depending on which half-inning we’re in and whether the replaced player has already batted.
- 5A slash on the corner indicates where in the batting order each inning ended.
Inning totals
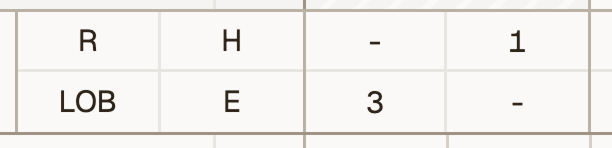
The bottom row of each inning column is divided into quadrants to show the total Runs, Hits, men Left On Base, and Errors in each inning.
Batter totals
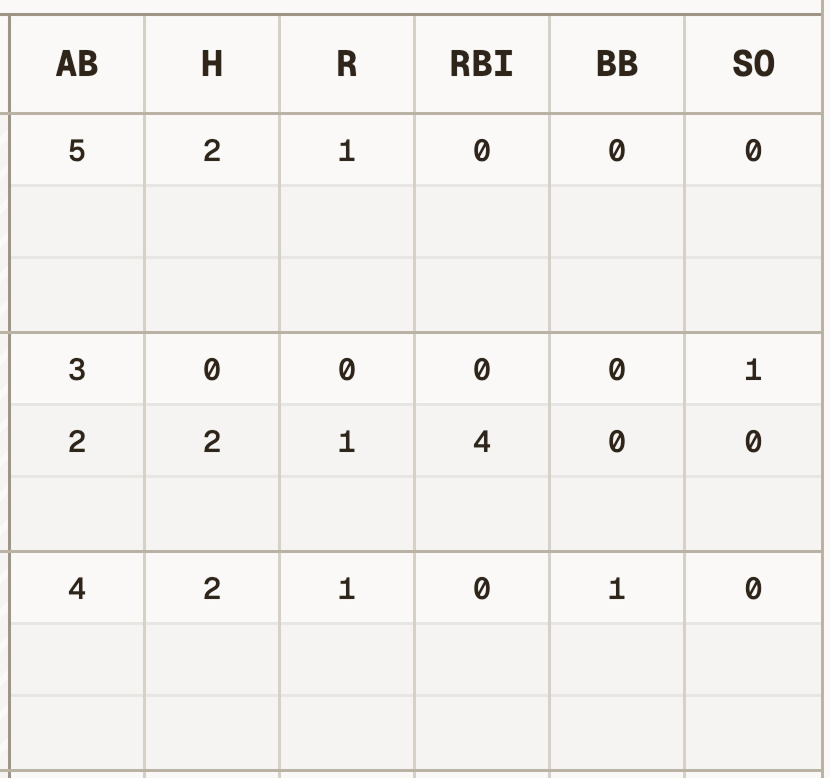
The last six rows of the batters’ table show various per-batter stats:
- ABAt-bats
- HHits
- RRuns
- RBIRunners batted in
- BBWalks (bases on balls)
- SOStrikeouts
Pitchers’ table
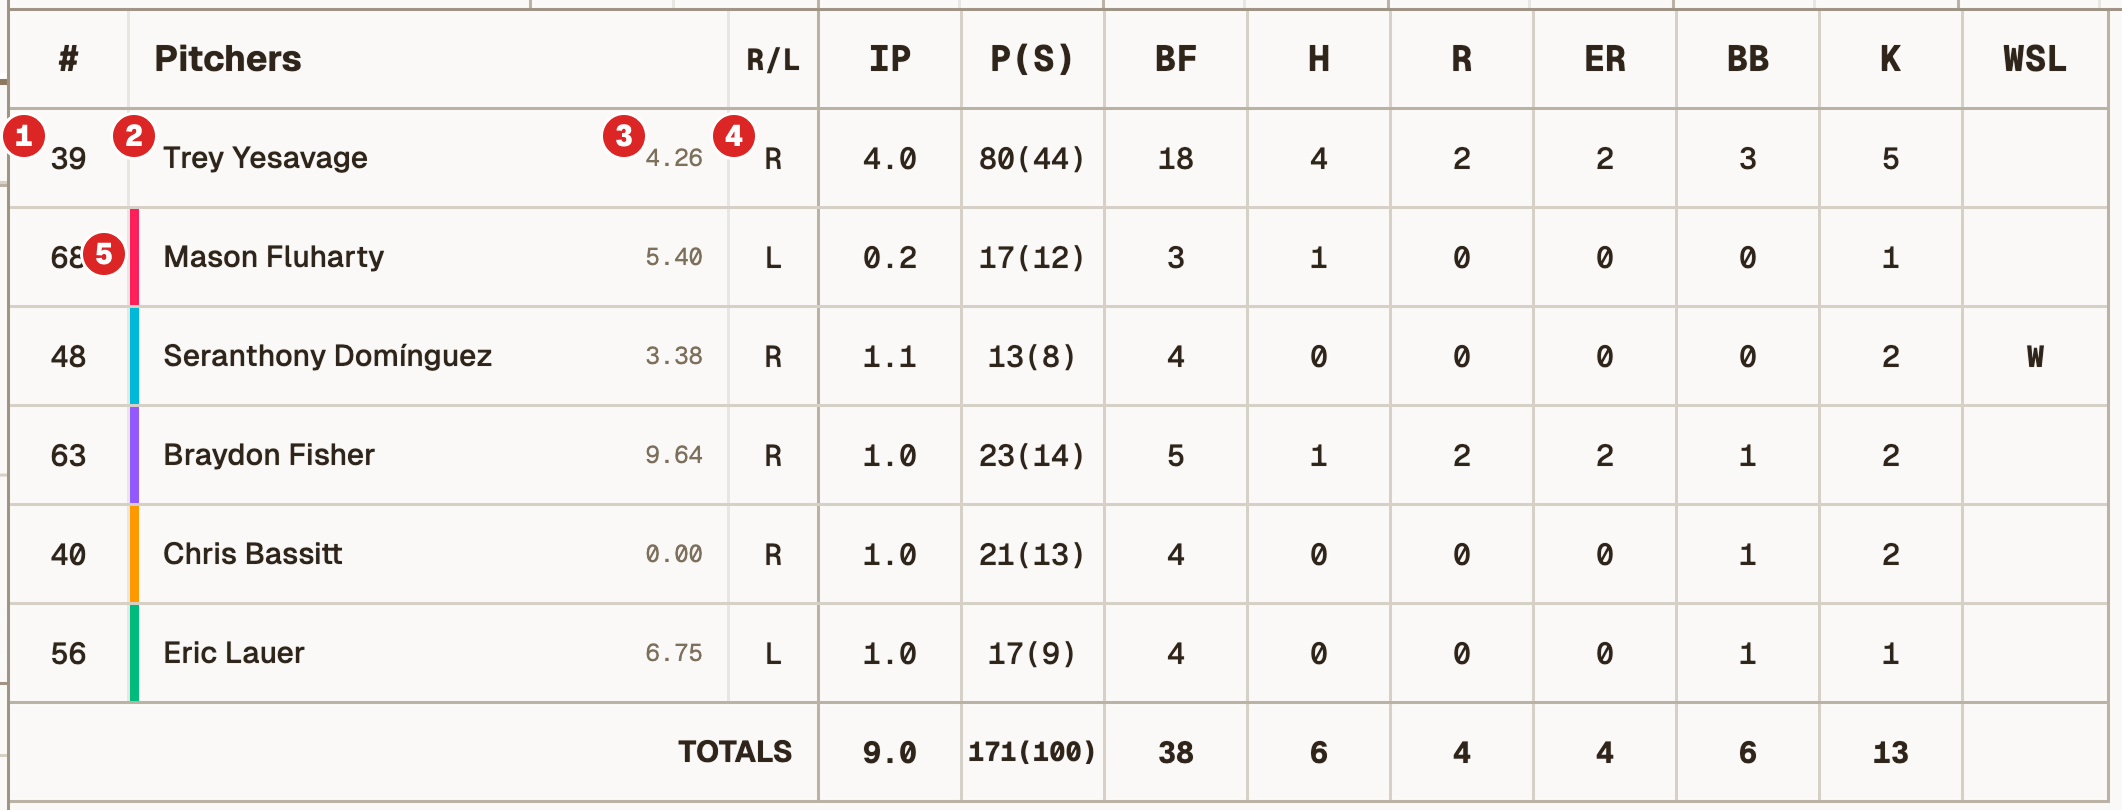
The pitchers’ table shows each pitcher’s jersey number,1name,2ERA,3updated throughout the game, and handedness.4For relief pitchers, a colored left border5matches the top border on the batter’s box where they entered the game. Also shown are their stats in the game:
- IPInnings pitched
- P(S)Pitches thrown (pitches thrown for strikes)
- BFBatters faced
- HHits allowed
- RRuns allowed
- EREarned runs allowed
- BBWalks (bases on balls)
- KStrikeouts
- WSLTheir win, loss, save, or hold decision
The defensive diagram
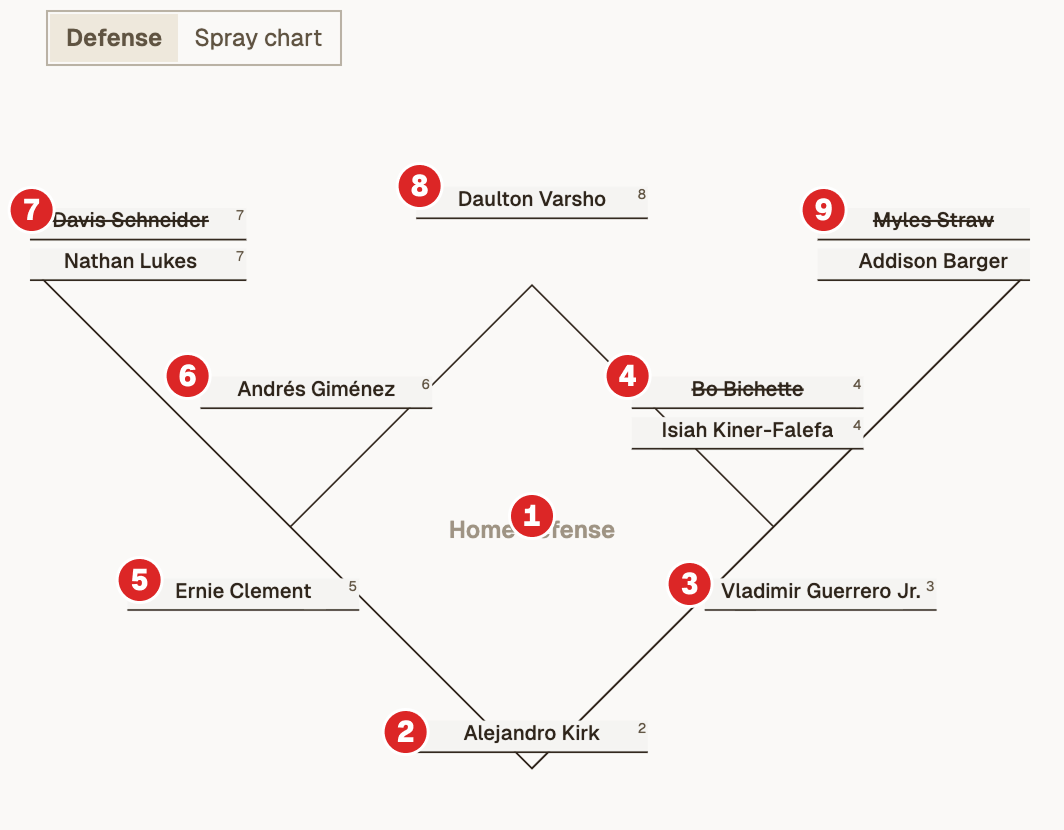
I like to keep track of defensive position in my #22 Scorebook, so I included here as well, below the batters’ table. Shown is a small diagram of the diamond, with slots for player names at each position, which are numbered as follows:
- 1The pitcher (not shown)
- 2Catcher
- 3First baseman
- 4Second baseman
- 5Third baseman
- 6Shortstop
- 7Left fielder
- 8Center fielder
- 9Right fielder
- 10Designated hitter (not shown)
Changes and substitutions are named in a secondary slot at each position. Names that are crossed out were removed from that position. Toggle this chart to Spray chart to see hit trajectories from this game overlaid on a ballpark outline.
Scorekeeping shorthand
Offense
- 1BSingle
- 2BDouble
- 3BTriple
- HRHome run
- BBWalk (bases on balls)
- IBBIntentional walk (bases on balls)
- KStrikeout swinging
- KStrikeout looking
- SACSacrifice
- FCFielder’s choice
- HBPHit by pitch (the greatest play in baseball)
Defense
- WPWild pitch
- PBPassed ball
- INTInterference
- BBalk
- E#Error (with position number)
- F#Fly out
- P#Pop out
- L#Line out
- G#Ground out
- #FFoul out
- SBStolen base
- CSCaught stealing
The expanded batter’s box
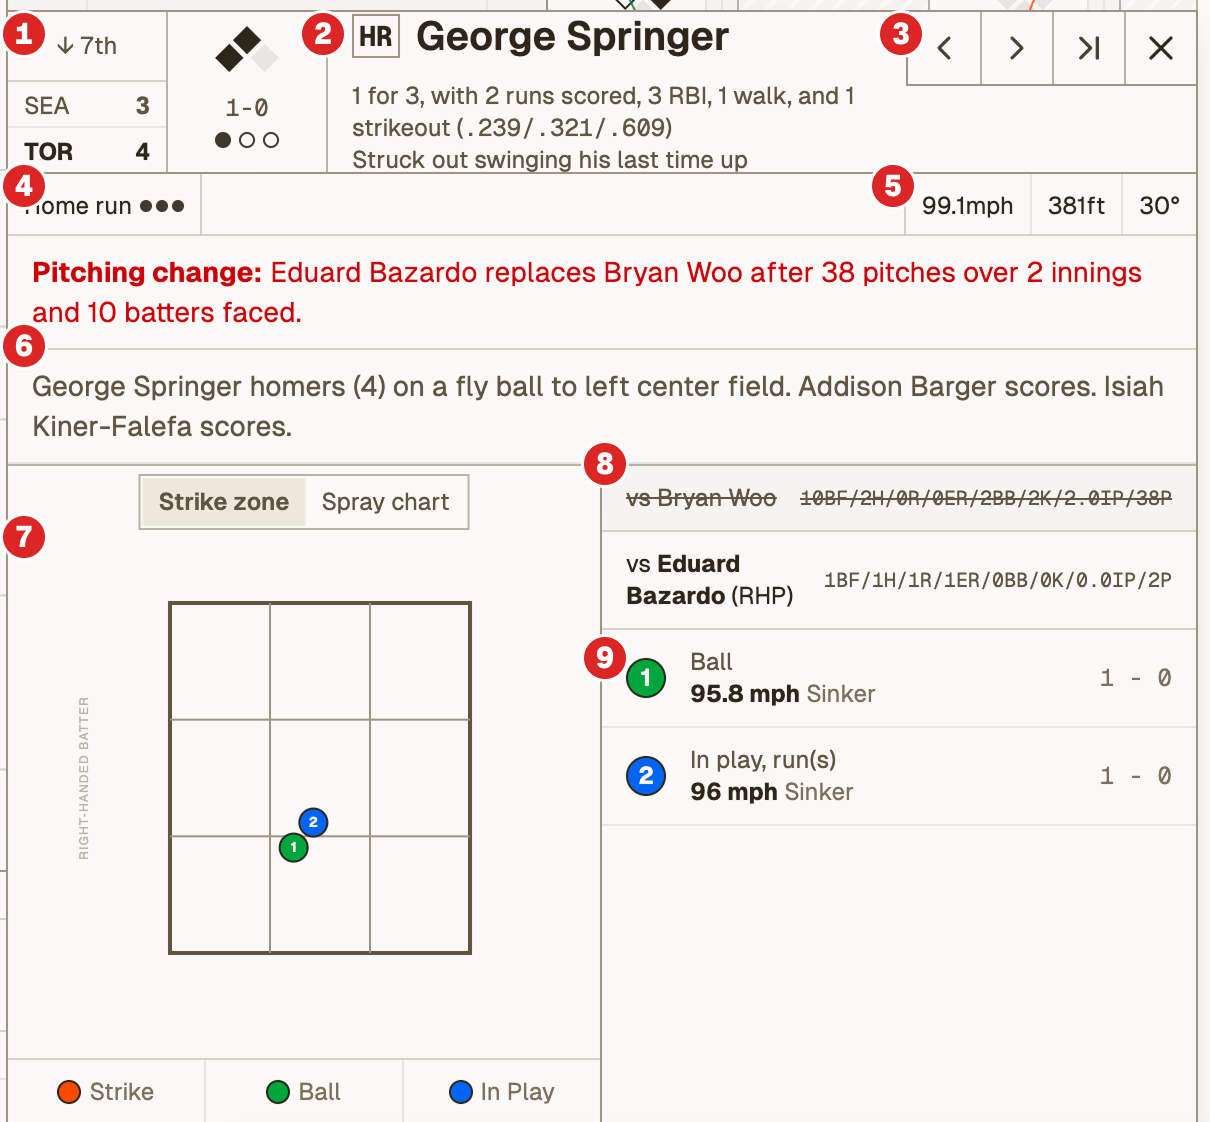
Want more details? Try clicking or tapping a batter's box to open the expanded version, with the following information:
- 1The scorebug at the time of the plate appearance, which shows the current inning, score, basepath situation, count, and number of outs.
- 2The result, if it’s happened, the player’s name, their statline so far, and his result last time up.
- 3Navigation to jump to the previous, next, or last at-bat.
- 4The written result and RBI dots.
- 5If the ball was put into play, the exit velocity, launch angle, and projected distance.
- 6Any substitutions which occurred during the at-bat, the description of the at-bat result, and the player’s subsequent movements on the basepaths.
- 7In the visualization column, a strikezone chart and a hit trajectory chart, known as a spray chart.
- 8The current pitcher’s stats in the game so far. If a pitcher substitution occurred, the previous pitcher is shown with a strikethrough.
- 9The pitch sequence during the at-bat.
Tip: use your arrow keys to navigate to the next or previous at-bat.
Live updates
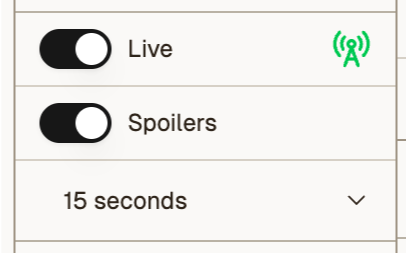
Games that are currently in progress will automatically update in real time. Turn this off, hide spoilers, or add a delay to sync with your TV or radio feed from the control panel at the top of the expanded left-hand panel. Your preference will be saved to your device.
Preferences are saved in your browser on this device.
The MLB API is automatically pinged every 3 seconds, pulling in any new data and displaying it in your scorecard.
The scorebug
When live updates (and spoilers) are enabled, a scorebug is displayed at the bottom left of the screen. It shows the current score, inning, number of outs, and the basepaths. When the left-hand panel is expanded, the bug also shows the count, the current pitcher name and pitch count, and the current batter’s name and game stats.
Click or tap the scorebug to expand the batter’s box card for the current or most recent at-bat.
For those wondering, the layout and information density was modelled after Sportsnet's Blue Jays scorebug, which is by far my favourite.
Challenges tab
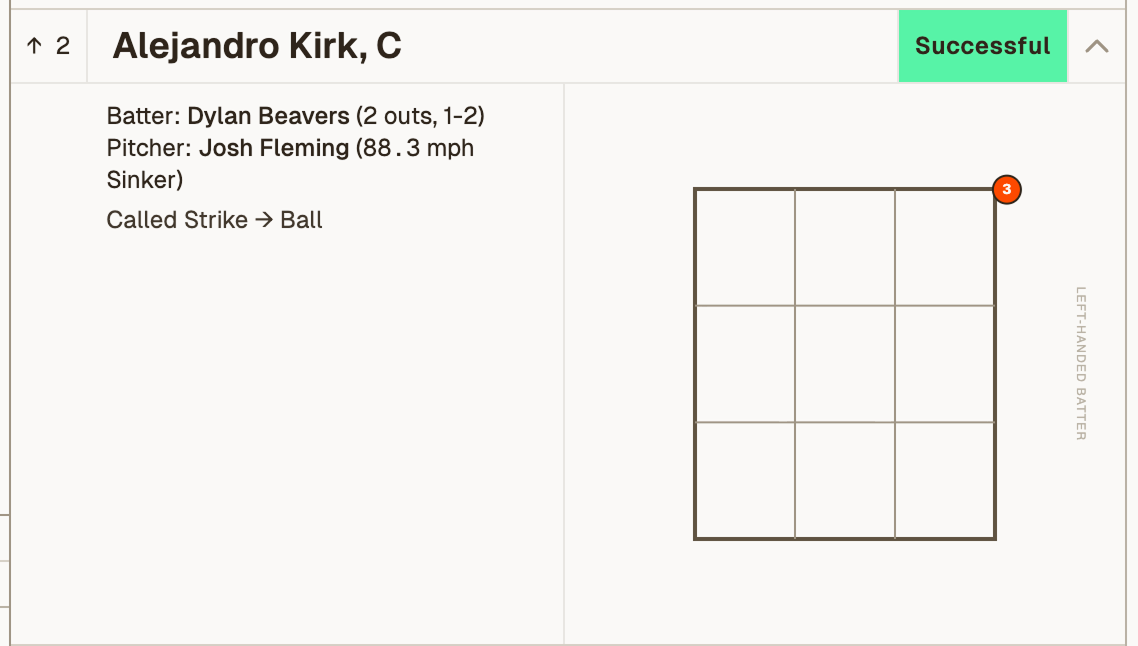
The challenges tab, accessible from the game page menu or by clicking the challenges remaining (CR) indicator in the box score, displays a grid of all challenges that have occurred during the game, organized by team. Each challenge shows the challenge initiator, the pitcher, the batter, and the result. Click a challenge to expand it and see a strikezone visualization indicating where the pitch was located.
Spray chart tab
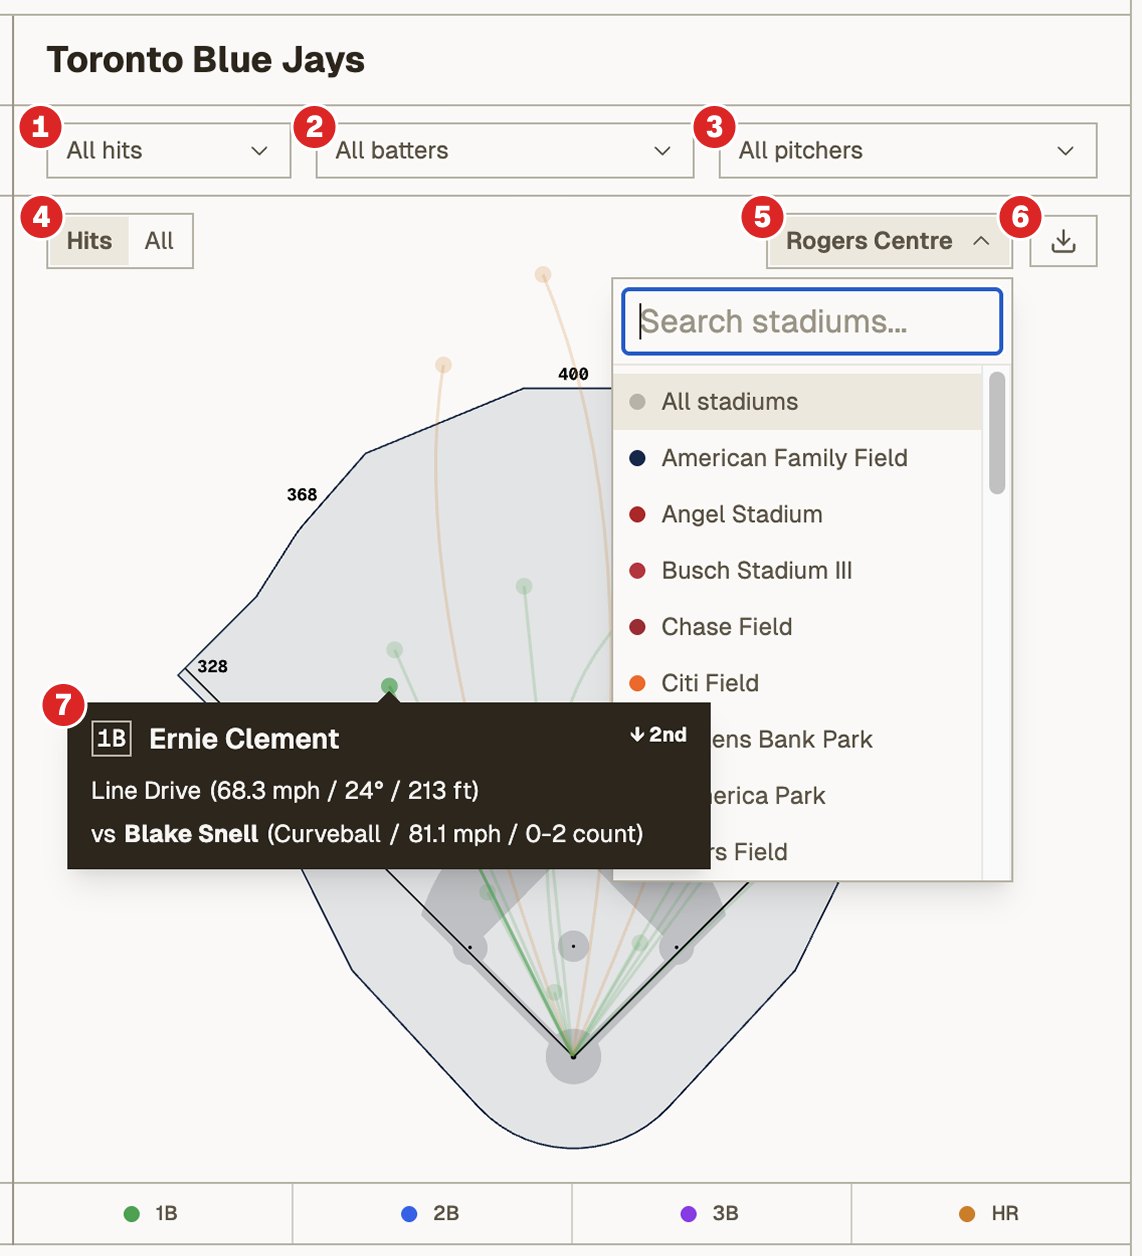
Navigate to the spray chart tab to see trajectories for all balls put into play during the game. Each ball is represented as a small dot, with a path representing its trajectory, coloured by type of hit. The spray chart is overlaid on the stadium outline the game was played at, with field dimensions where available. Games without stadium outlines are shown on Rogers Centre (for now). Each team has a chart, with the following functionality:
- 1Filter by type of hit (outs, singles, doubles, triples, and home runs)
- 2Filter to hits by a specific batter
- 3Filter to hits off of a specific opposing pitcher
- 4Toggle between hits only and all balls in play
- 5Add multiple stadium overlays or select all. This feature currently supports the 30 active MLB ballparks.
- 6Download the filtered spray chart as a PNG image (still a work-in-progress!)
- 7Hover over a hit to see details
Tip: click or tap a batter’s name in the scorecard view to open the spray chart for that batter.
While we strive for accuracy, there may be slight discrepancies between MLB hit data and our stadium outlines, and as such are meant to be illustrative only.
Pitch chart tab
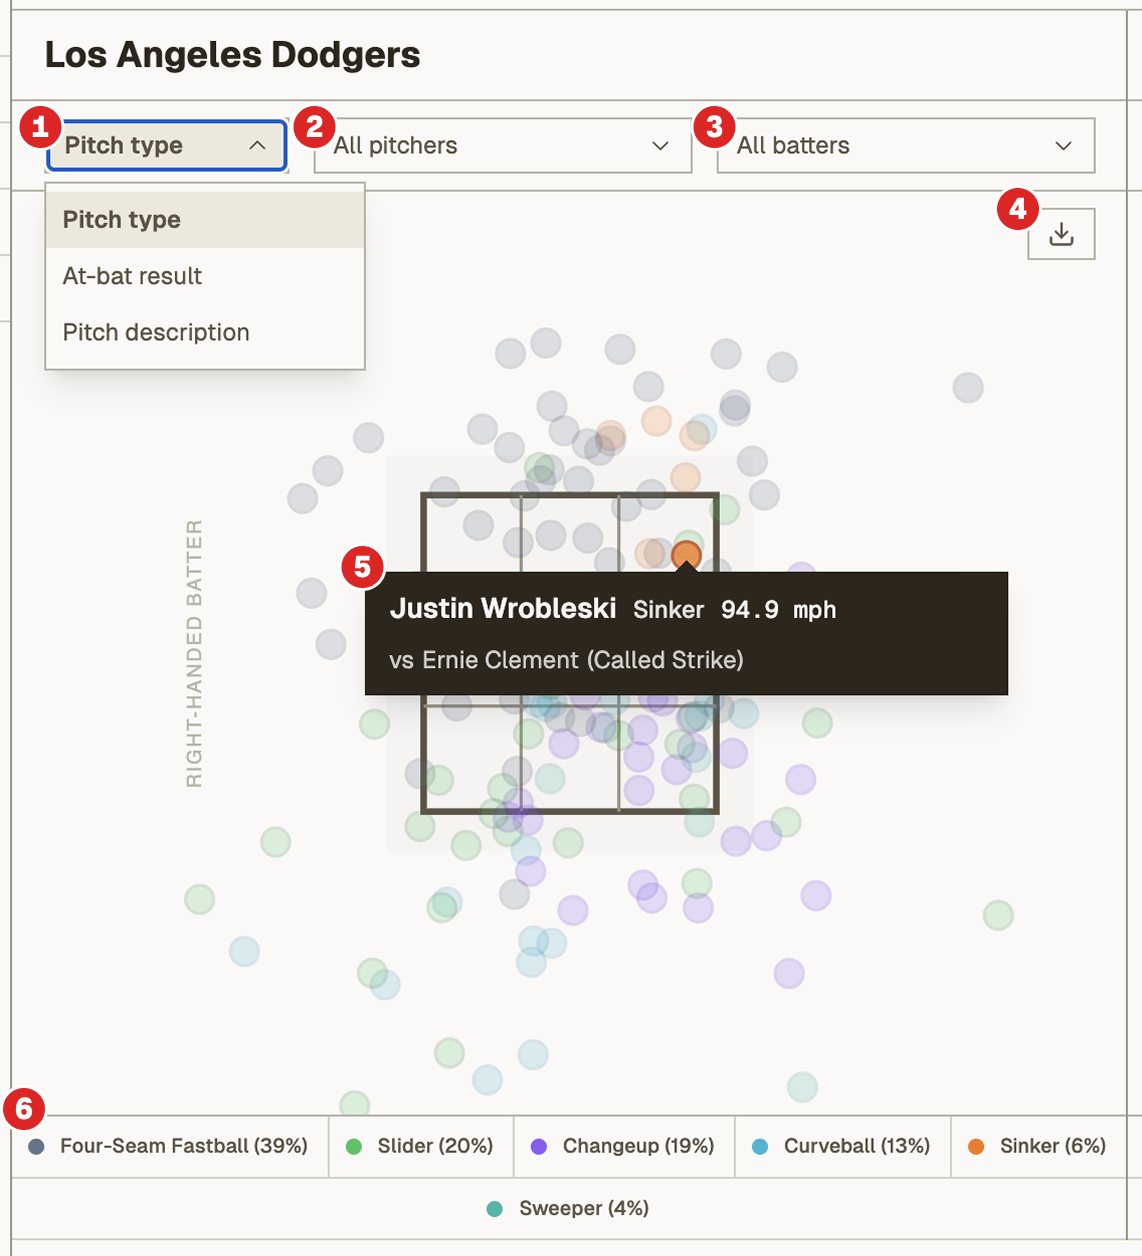
Navigate to the pitch chart tab to see strike zone visualizations for all pitches thrown during the game. Each pitch is represented as a to-scale circle, overlaid on a standard strike zone and coloured based on the selected filters. Each team has a chart, with the following functionality:
- 1Change the view to colour pitches by pitch type (fastball, slider, curveball, etc.), at-bat result (strikeout, single, double, etc.), or pitch description (ball, swinging strike, foul, etc.)
- 2Filter to pitches thrown by a specific pitcher
- 3Filter to pitches thrown to a specific opposing batter
- 4Download the filtered visualization as a PNG image (still a work-in-progress!)
- 5Hover over a pitch to see details
- 6The legend updates based on the selected filters above
Tip: click or tap a pitcher’s name in the scorecard view to open the pitch chart for that pitcher.
While we strive for accuracy, there may be slight discrepancies between MLB pitch data and how we render it.
Ballpark guides
Switch to the Ballpark tab (or choose one from the ballparks page) to take a deeper dive into the stadium, its history, and its changing field shapes. We’re having a lot of fun digging into the history of each major league ballpark, as well as all the ballparks the home team used to play at, and welcome any suggestions or artifact submissions!
The timeline
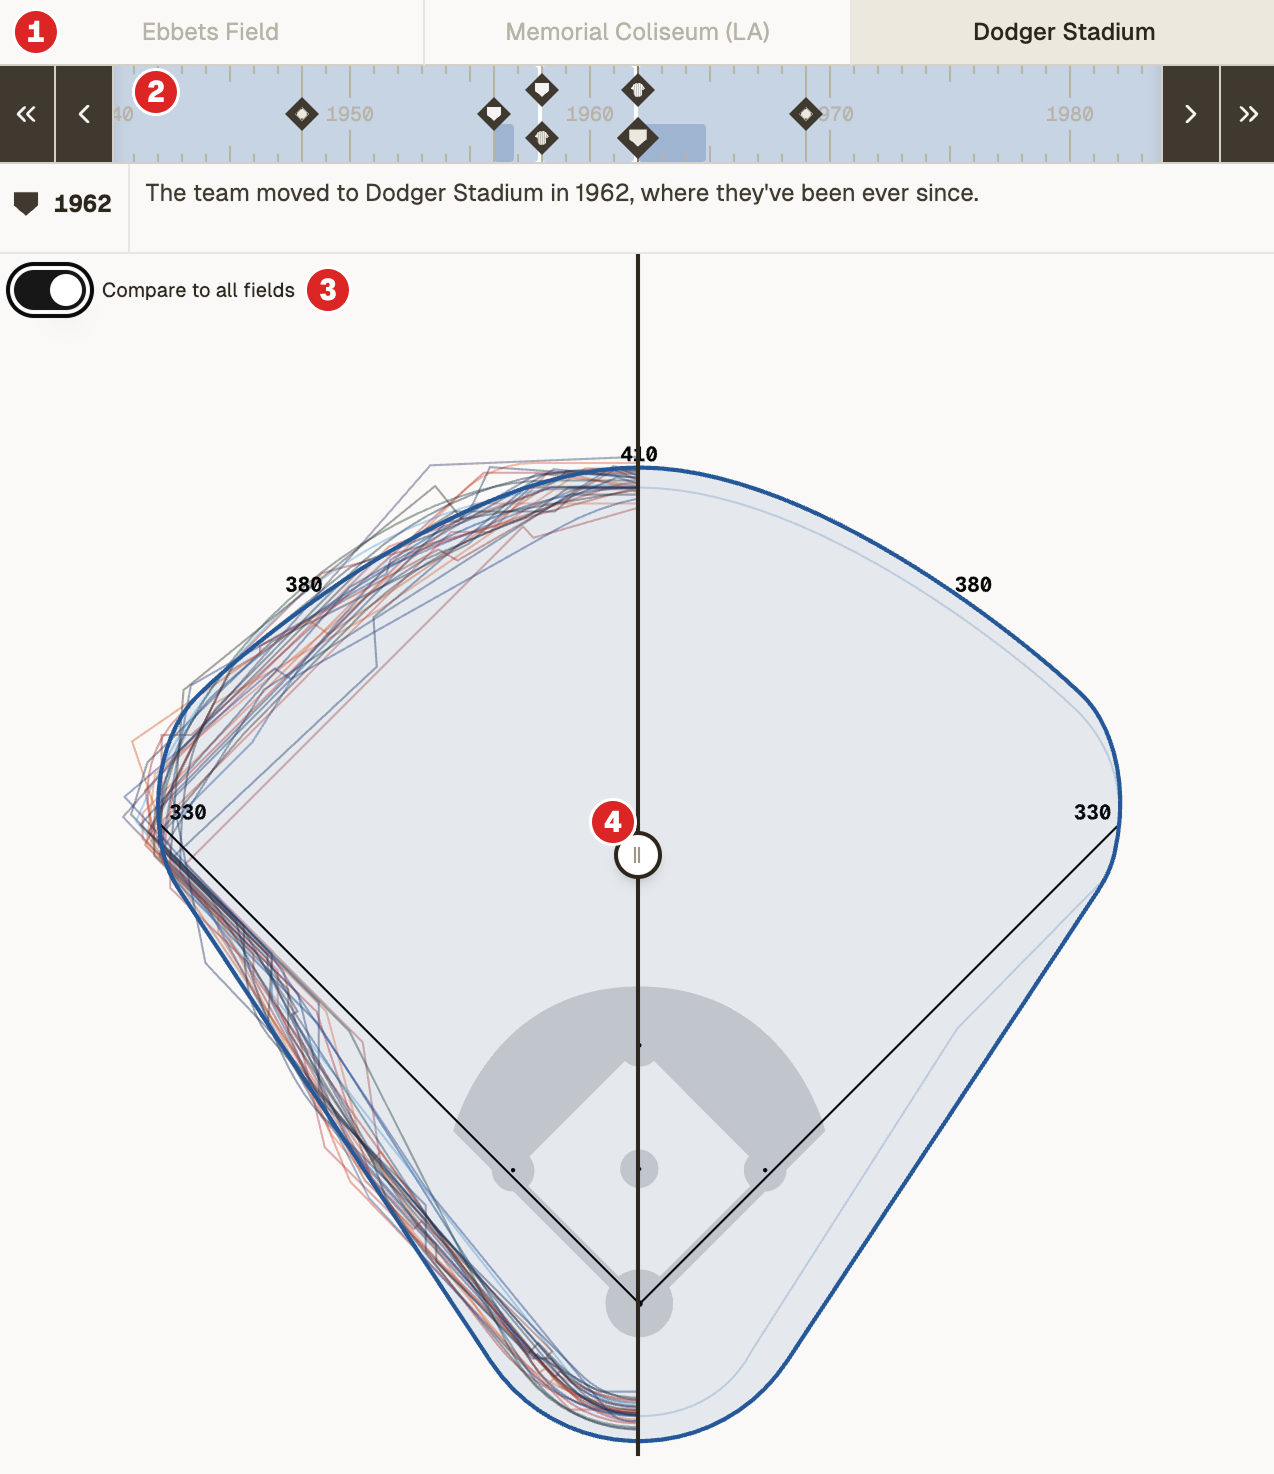
We’re particularly excited about the timeline, which is mostly working. It has a few fun features:
- 1Select a ballpark the team has played at in the past to jump back in time
- 2Drag or scroll the timeline scrubber (or use the forward/back buttons) to move through time. Points are represented by diamonds: pennants mark the franchise’s start; homeplates indicate the team relocated (city or stadium); flags means the stadium changed names; jerseys mean the team changed names or a different team moved in; and diamonds means the field changed shape.
- 3Toggle on the compare mode to see how the currently selected stadium, wherever you are in its history, compares to all current major league ballparks.
- 4Drag the slider to compare.
Dimensions table
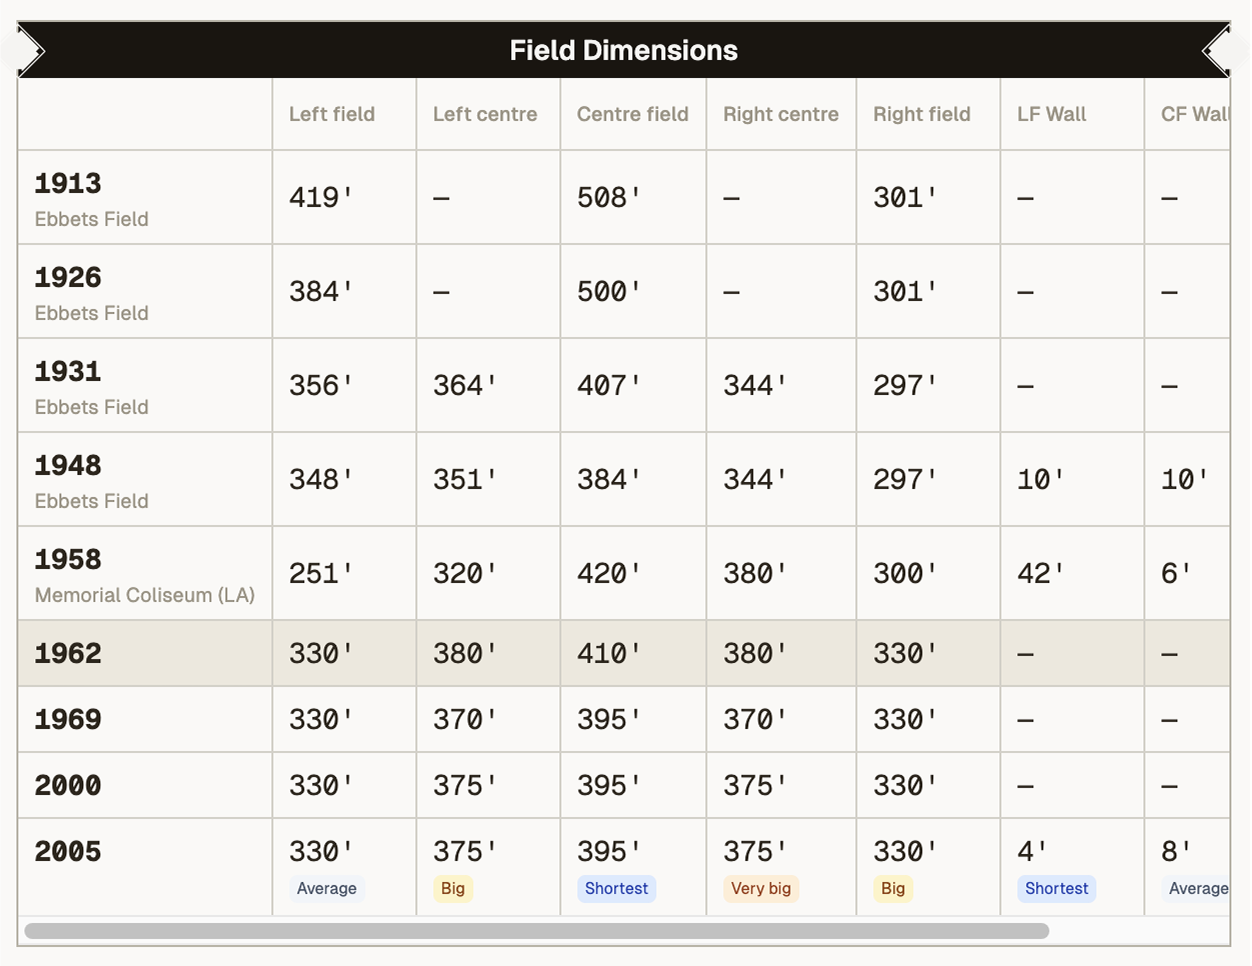
Below the timeline is a full table of field dimensions, including the distance from home plate to the fence at left field, left centre, centre field, right centre, and right field, as well as wall heights where available.
By default, the table shows the dimensions for each field iteration and ballpark in the current team’s history. Click a row to jump to that field in the timeline and visualization.
Toggle on compare mode above and the table changes to show the currently selected field iteration or ballpark compared to all current major league ballparks. Click a column header to sort. Click again to inverse the sorting.
Small tags are displayed in each cell to indicate if the dimension is shorter, average, or larger than the average for all current major league ballparks.
Other features
Some more exciting and experimental features we’re working on include:
- PDF exports from the scorecard tab.
- Game preview tab showing player stats, team standings, head-to-head and historical records, matchups, and more.
- Team pins: click the bookmark icon next to a team name in the games grid to pin that team’s games to the top of the games list going forward. Preferences are saved in your browser on this device.
- Play-by-play tab showing all plays in the game, in sequential order. Click or tab a play to open the expanded batter’s box.
- Red stars: as part of my own small celebration of Buck Martinez’s career, we’ve added a new feature to mark stellar defensive plays with a red star. Click the star icon in a batter’s box to star a stellar defensive play, with the option to save locally or share with other users. None of your information is stored on our server when clicking this button. The only data saved is the game and play ID so we can mark this play as starred for other users. Preferences are saved in your browser on this device.